Analysis Builder
Quickly explore and troubleshoot with all trended data over any date range by selecting data points and generating graphs. Develop your own ad-hoc rules using a user-friendly interface where you can build, save, and share graphs with other users.
This is a way to quickly view and analyze the most recent data from your building.
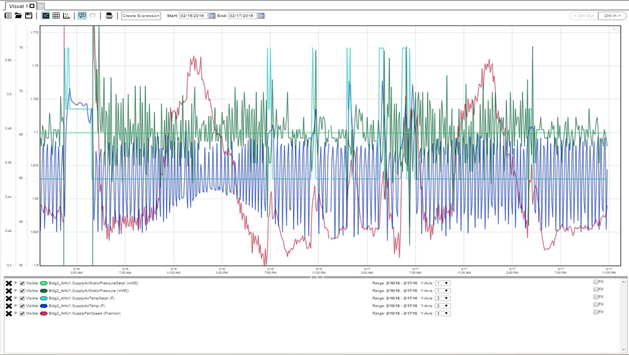
To Create Graph:
1) Click the box next to the building you wish to analyze (even if you only have access to one building, you must choose it).
2) Click the box next to the system to be analyzed.
3) Double click to select points.
4) Change display colors, date ranges, and y-axes groupings using the menu options for each point. You can also select the fill box to fill in under data points.
5) To create multiple graphs in the same browser window click on the “+” tab right below the banner at the top of your screen and repeat steps 1-5.
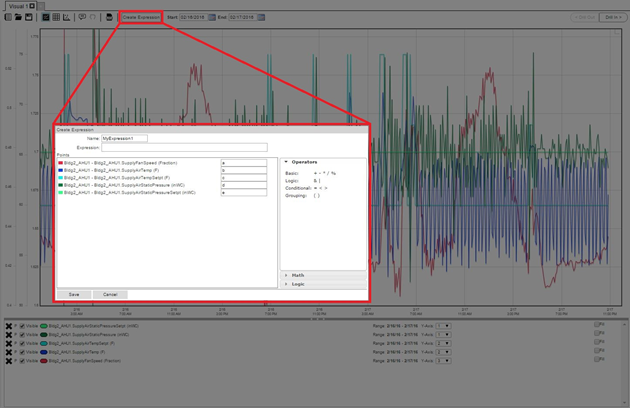
6) Create mathematical expressions to manually analyze the data using the “Create
Expression” button in the upper right. This will bring up a dialog box, shown below which allows you to write simple expressions on the data, which can then be graphed with the raw data.
Notes on creating expressions:
- To see syntax for mathematical and logical operators hover mouse over the desired function and a popup will appear
- Mathematical and Logical operators are case sensitive
To save and share graphs:
1) Click on “View Properties” and within their respective text boxes type the graph name, description of the graph and any notes you have
2) Only if you want to share the graph with everyone that has access to the data you are viewing through Analysis Builder then check the “Shared Read” box under “View Properties.” If you want to everyone to be able to edit the graph then also check the box next to “Shared Write.”
3) Click on the “Save” and confirm that you want to save the graph.
Graph Function Buttons
The buttons right above the graph allow you to perform a variety of tasks.
 “View Properties” – Create custom names and notes and also define the access permissions for the current graph.
 “Save” – Saves the current graph on the Clockworks site using the preferences defined in the “View Properties” section
 “Open” – Open previously saved graphs and graphs that have been created by others and shared with you.
 “Line Chart” – Shows the data as a line chart. Default option in Analysis Builder, only need to select this if you previously selected one of the other view options.
 “Table View” – Shows the data currently being displayed in the graph as a table. Includes color formatting from line chart for easy visual acquisition.
 “Scatter Plot” – Shows the data currently being displayed as a scatter plot. Includes color and axis information from line chart.
 “Annotation” – Allows the user to add annotations to the graph they’re currently viewing. Click the Annotation button then right click on a point on the graph to add, edit, or remove an annotation.
 “Pan” – Allows the user to pan along a zoomed-in graph. Click the pan button while viewing a zoomed-in graph and click and drag right or left along the visual to change the view.
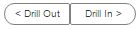 “Drill Out/Drill In” – Allows the user to switch between different levels of zoomed views that have already been created. “Drill Out” moves to the next view up until the original view, and “Drill In” moves to the next view down until
the smallest zoom view that had been created.
Notes on zooming:
- You can zoom normally as long you don’t have the “Pan” tool selected. Simply click on the graph and drag a window over the area you would like to zoom in on.
- You can also double click on a point or area of the graph and zoom in a set amount toward that point.
The following icon only appears when viewing data as a table:
 “Export” – download the current data as a CSV file
The following icon only appears when viewing data as a line chart or scatter plot:
 “Export” – download the current graph or scatter plot as a PDF file