Reporting
The Reporting module provides the ability to export raw and calculated data from Clockworks and generate reports with graphs and text. Accelerate M&V and share reports to direct the resolution of equipment and system issues.
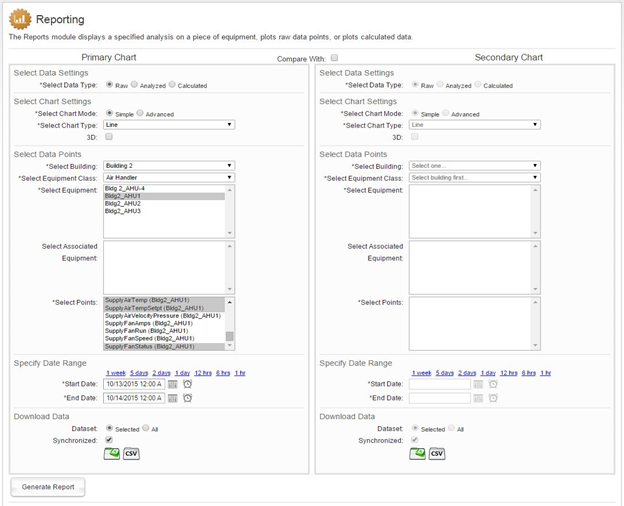
To navigate:
1) Choose “Raw”, “Analyzed”, or “Calculated” data.
2) Select Building, Equipment Class, Equipment, Associated Equipment, and Points you wish to view. To select multiple points at once, press “Ctrl”.
3) Select date range for data. You can auto-fill the date ranges by clicking the prior 1 week, 5 days, 2 days, or 1 day. You can also type specific dates to create your own range.
4) If you wish to produce 2 graphs, check the box at the top that says “Compare With” and repeat steps 1-3 on the right hand side under “Secondary Chart”.
5) To download raw data, click on either “Download Excel” or “Download CSV.”
(NOTE on the XLS file downloads: When you open the file, excel might tell you it doesn’t recognize the file format and ask if you want to continue to open it. Click “Yes” and it will open like any other XLS file. CSV files are recommended, however, because they tend to be smaller in size.)
6) To view a graph of the data, click “Generate Report.”
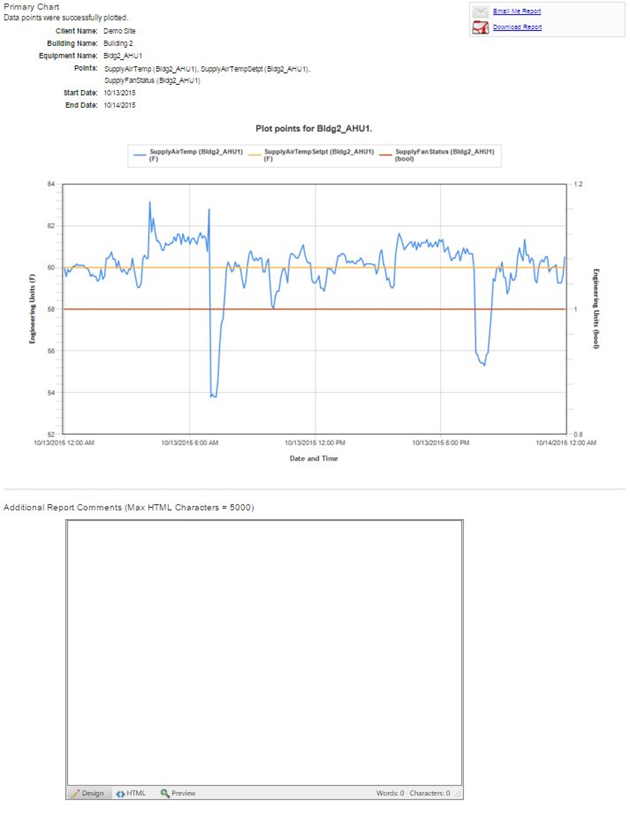
If you click “Generate Report”, a graph showing the primary chart data will appear at the bottom of the page (as well as a separate chart for secondary data if selected). If the selected points are all the same units (for example °F), the left-hand axis will display those units. If the selected points have two different units (for example °F and CFM), separate right- and left-hand axes will appear, each labeled with one of the units. If there are more than 2 units in the group of points selected, only the left-hand axis will appear, and will include a scale to cover all units. In this case the axis will read “Engineering Units.” For ease of reading the graph, we recommend selecting only a few types of points at once, unless the units are of similar scale.
To add custom notes, use the text box that appears below the graph(s). This box can be used to write observations, to make notes, or to give another person maintenance instructions.
You can download the whole report as a PDF or have it sent to the email that is associated with your account. The report will include the graph(s) created as well as any custom notes you include.
See the next page for a sample output.